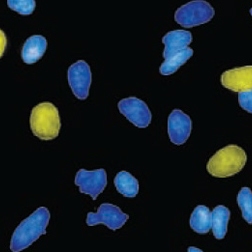
Apoptosis
Apoptosis assays are a widely used application in High Content Analysis because of their central role in cancer research and immunology.
Apoptosis assays are a widely used application in High Content Analysis because of their central role in cancer research and immunology.
There are two main pathways for the induction of apoptosis: the death receptor-mediated pathway and the mitochondrial pathway.
Induction of either pathway will result in the activation of caspases, a class of intracellular cysteine proteases which are considered to be the central components of the apoptotic response.
Imaging based analysis of caspase activation, mitochondrial function and nuclear fragmentation are typical high content apoptosis assays.
Cell cycle
Cell cycle assays are applied in early toxicity testing and in screening for anti-cancer agents. One of the most important aspects in anti-cancer treatments is the inhibition of cell proliferation and cell division.
Cell cycle assays are applied in early toxicity testing and in screening for anti-cancer agents. One of the most important aspects in anti-cancer treatments is the inhibition of cell proliferation and cell division.
Both events can be analyzed using High Content Screening (HCS) approaches by multiplexing cell cycle-specific cellular events. Examples are BrdU or EdU staining, which detect the S-phase of the cell cycle by incorporating the nucleoside analog Uridine into newly synthesized DNA strands.
There are also well validated protein markers that are associated with certain cell cycle phases. One example is the phosphorylated histone H3 (pHH3), which is a common M-phase marker. DNA histogramming is another basic analysis tool which transfers very well to image based automated analysis of DNA content per cell.
High Content Screening can quantify all the cell cycle analysis readout parameters which are used in flow cytometry, the traditional tool for cell cycle analysis. Cell cycle analysis relies greatly on statistics over a large number of cells so to get reliable data it is essential to acquire multiple image fields per sample combining data from several thousand cells. A large number of cells must be analyzed in a short period of time in order to achieve an acceptable screen throughput.
Cell differentiation
Cell differentiation is a multi-step procedure associated with the expression of a specific set of cellular markers in each step, for example the progression of a pluripotent stem cell to a progenitor cell and a fully differentiated tissue specific cell type. The morphology of the cell also changes during differentiation.
Cell differentiation is a multi-step procedure associated with the expression of a specific set of cellular markers in each step, for example the progression of a pluripotent stem cell to a progenitor cell and a fully differentiated tissue specific cell type. The morphology of the cell also changes during differentiation.
Cell migration
Analysis of cell migration is an important phenotypical assay of processes such as tumor metastasis, immune response and wound healing.
Analysis of cell migration is an important phenotypical assay of processes such as tumor metastasis, immune response and wound healing.
There are four different types of cell migration: migration of cells based on a chemical environment (chemotaxis); cell migration within a gradient of chemoattractants (haptotaxis); movement of cells through the vascular endothelium (transmigration), and migration of cells into a wound to close the gap (wound healing).
Most of these assays are compatible with an imaging based readout. Recent strategies have resulted in more advanced cell migration assays that are more accurate, sensitive, convenient and robust, especially in wound healing.
Cell proliferation
Cell proliferation is the increase in cell number as a result of cell growth and division.
Cell proliferation is the increase in cell number as a result of cell growth and division.
The accurate assessment of cell number and cell proliferation is useful in many high content assays and is a key readout in cytotoxicity and apoptosis applications. Cell proliferation is also a very sensitive indicator of cell stress since it requires intact cell structures and function.
Cell shape changes
The shape of a cell can change in response to many different stimuli. The rounding up of cells from an attached and spread-out state on a substrate, for example, can be observed when cells are dividing or experiencing toxic effects.
The shape of a cell can change in response to many different stimuli. The rounding up of cells from an attached and spread-out state on a substrate, for example, can be observed when cells are dividing or experiencing toxic effects.
Analysis of cell spreading is relevant to screening for inhibitors of cell adherence to a substrate. Common measures of the cell shape are area, roundness and width to length ratio.
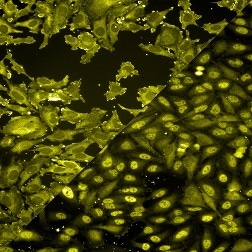
Cytoskeletal rearrangement
The cytoskeleton, a filamentous network of actin, tubulin and other protein components, is essential for cellular structure, maintenance, intracellular transport, cell division and many other functions.
The cytoskeleton, a filamentous network of actin, tubulin and other protein components, is essential for cellular structure, maintenance, intracellular transport, cell division and many other functions.
Cytoskeletal rerarrangements occur in physiological events such as cell movement. Cytoskeletal defects are frequently associated with diseases such as cancer / metastasis and also cytotoxicity.
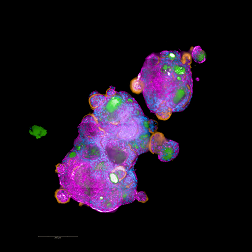
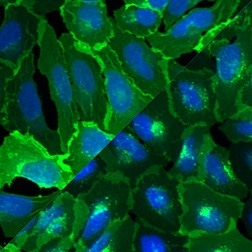
Image shows untreated cells(upper left) – structured distribution of tubulin with high intensity near the nucleus and decreasing intensity near the plasma membrane. Re-arrangement of tubulin due to treatment with Demecolcin (lower right).

Cytotoxicity
The ability to measure early indicators of toxicity is an essential part of drug discovery. In vitro cytotoxicity assays involving tissue specific cell cultures are considered as valuable predictors of human drug toxicity. As a primary organ for drug metabolism, the liver is often subject to toxic effects, so in vitro cellular cytotoxicity studies focus on human hepatocytes.
The ability to measure early indicators of toxicity is an essential part of drug discovery. In vitro cytotoxicity assays involving tissue specific cell cultures are considered as valuable predictors of human drug toxicity. As a primary organ for drug metabolism, the liver is often subject to toxic effects, so in vitro cellular cytotoxicity studies focus on human hepatocytes.
Early and late indicators of in vitro cytotoxicity include plasma membrane integrity, mitochondrial mass and mitochondrial membrane potential, cell number, caspase activation, nuclear swelling and shrinking and DNA fragmentation.
Determining the count of a cell population is a very sensitive indicator of cell stress since cell proliferation requires intact cell structures and function.
Cytotoxicity assays and their desired readout parameters can vary largely, depending on target cells and compound type. Adaptation of the assay with respect to reagent used, parameters to be evaluated, end point, live or fixed cells and number of cells per sample is critical.
Infection
Traditionally an area for flow cytometry, many infection assays have been transferred from flow cytometry to imaging. High content analysis of cellular infection with pathogens encompasses a large number of different processes about which an imaging based readout can provide essential insights.
Traditionally an area for flow cytometry, many infection assays have been transferred from flow cytometry to imaging. High content analysis of cellular infection with pathogens encompasses a large number of different processes about which an imaging based readout can provide essential insights.
It starts with monitoring interactions between a pathogen and the cell surface and the entry of the pathogen into the cell. It involves the understanding of cellular signal transduction and transcriptional response to pathogen infection, all the way to real-time monitoring of cell viability during an infection process.
High resolution confocal imaging, as provided by our Opera Phenix® Plus and Operetta® CLS™ instruments, is an essential technology for a number of assays for infectious diseases. It enables 'mix and measure' homogeneous assays without the need for 'wash away' steps greatly simplifying the assay set-up process for high throughput screening, e.g. when adding an excess of labeled antibody. High resolution imaging is essential for distinguishing punctate signals from evenly distributed signals, for example when analyzing association of viral spikes with lipid rafts.
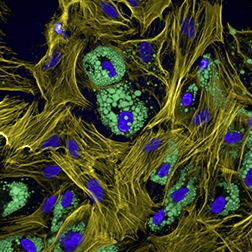
Lipid droplet analysis
Image based analysis of lipid droplet formation is used in two application areas: predicting drug toxicity and metabolic diseases.
Image based analysis of lipid droplet formation is used in two application areas: predicting drug toxicity and metabolic diseases.
Predicting drug toxicity is a major concern for drug regulatory agencies. Phospholipidosis, a lipid storage disorder in which excess phospholipids accumulate within cells, can occur as an adverse drug reaction with many cationic amphiphillic drugs. Drug-induced phospholipidosis in hepatocytes causes failure of the liver, kidney and respiratory system. High Content Assays for phospholipidosis, for example by staining intracellular lipid droplets with fluorescent dyes, are used to predict the toxicity of a compound.
Metabolic diseases can cause a variety of disorders such as hepatosteatosis, which is fat deposition in hepatocytes in the liver. These fat deposits can be visualized and analyzed using High Content Analysis. Other factors that contribute to hepatosteatosis include alcohol, drugs and nutritional disorders.
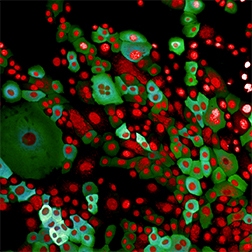
Image shows lipid droplets in cells, visualized using Bodipy 493/503.

Neurite outgrowth
Regeneration of neurons represents a promising strategy for drugs targeted against neurodegenerative injuries and disorders such as Alzheimer's and Parkinson's disease. The development of new therapies is focused on identifying molecules that affect the differentiation of neurons and neurite outgrowth.
Regeneration of neurons represents a promising strategy for drugs targeted against neurodegenerative injuries and disorders such as Alzheimer's and Parkinson's disease. The development of new therapies is focused on identifying molecules that affect the differentiation of neurons and neurite outgrowth.
For this purpose automated measurement and analysis of neuronal cells is essential for neuroscience research and drug discovery. Neurotoxicity is another important area where neurite outgrowth analysis is applied.
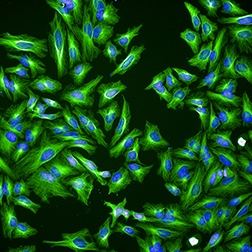
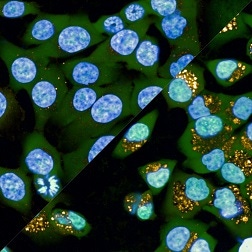
Image shows impact of NGF on neurite outgrowth of NS-1 cells. Confocal images of control (upper left panel) and NGF treated (lower right panel) NS-1 cells. Hoechst 33342 stained nuclei are shown in blue. α-tubulin was labeled by immunofluorescence with Alexa Fluor® 488 and is shown in green.
Protein expression
Protein expression can be very easily quantified in High Content Analysis using either fluorescent protein tags or fluorescently labeled antibodies. Expression on the plasma membrane, in the cytosol and in the nucleus can be distinguished by defining the respective cellular regions.
Protein expression can be very easily quantified in High Content Analysis using either fluorescent protein tags or fluorescently labeled antibodies. Expression on the plasma membrane, in the cytosol and in the nucleus can be distinguished by defining the respective cellular regions.
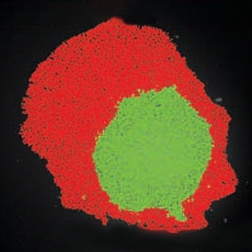
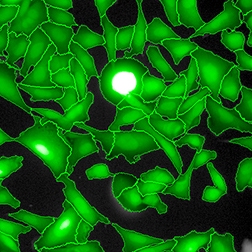
Example of membrane bound marker (upper left), blue – Hoechst 33342 nuclear dye, green – membrane bound receptor labeled by a fluorescent protein. Region of Interest for protein detection (lower right).
Receptor activation
There are many image based approaches for studying receptor activation. Binding of fluorescently labeled ligands to the receptors on the plasma membrane, eventually followed by internalization of the ligand-receptor complex is one of them.
There are many image based approaches for studying receptor activation. Binding of fluorescently labeled ligands to the receptors on the plasma membrane, eventually followed by internalization of the ligand-receptor complex is one of them.
A more relevant method of studying receptor activation is to monitor the processes which follow activation of a receptor, such as internalization and endocytosis of activated receptors carrying a fluorescent tag. This produces a more accurate readout with less false positives.
A more relevant method of studying receptor activation is to monitor the processes which follow activation of a receptor, such as internalization and endocytosis of activated receptors carrying a fluorescent tag. This produces a more accurate readout with less false positives.
Another approach is based on signal molecule recruitment to activated receptor complexes. G protein coupled receptor (GPCR) activation, for example, can be studied by the binding of arrestin carrying a fluorescent protein tag followed by the formation of fluorescent clathrin-coated pits at the cell surface or fluorescent clathrin-coated vesicles in the cytoplasm.
One of the earliest structural changes observed in cells in response to many extracellular factors is membrane ruffling: the formation of motile cell surface protrusions containing a meshwork of newly polymerized actin filaments.
It is becoming clear that actin reorganization is an integral part of early signal transduction pathways, and that many signaling molecules interact with the actin cytoskeleton.
Reporter gene
Reporter gene assays have easily measurable phenotypes that form the basis of sensitive, quantitative and reproducible assays of eukaryotic gene expression and regulation. Specifically, researchers can use reporter genes to characterize the strength of promoters and enhancers, define the role of transcription factors, assess transfection efficiency or the like. Fluorescent proteins are the most common fluorescent probes for imaging-based reporter gene assays.
Reporter gene assays have easily measurable phenotypes that form the basis of sensitive, quantitative and reproducible assays of eukaryotic gene expression and regulation. Specifically, researchers can use reporter genes to characterize the strength of promoters and enhancers, define the role of transcription factors, assess transfection efficiency or the like. Fluorescent proteins are the most common fluorescent probes for imaging-based reporter gene assays.
Signalling pathway analysis
Image based High Content Analysis can support all signaling pathway assays which rely on the translocation of a fluorescently labeled signaling molecule. Transcription factor activation, for example, can be monitored based on their translocation from cytosol to nucleus. Many other signaling molecules translocate from the cytosol to receptor complexes at the plasma membrane.
Image based High Content Analysis can support all signaling pathway assays which rely on the translocation of a fluorescently labeled signaling molecule. Transcription factor activation, for example, can be monitored based on their translocation from cytosol to nucleus. Many other signaling molecules translocate from the cytosol to receptor complexes at the plasma membrane.
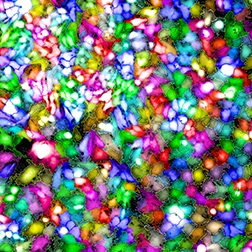
Transcription factors
Transcriptional regulation of genes comprises a multistep process. It starts with the activation of one or more transcription factors in the cell cytoplasm, movement of the transcription factor(s) into the nucleus, and binding to its associated DNA consensus sequence, which initiates the transcription of specific genes. This plays an important role in regulating inflammatory and autoimmune responses, cell proliferation and apoptosis.
Transcriptional regulation of genes comprises a multistep process. It starts with the activation of one or more transcription factors in the cell cytoplasm, movement of the transcription factor(s) into the nucleus, and binding to its associated DNA consensus sequence, which initiates the transcription of specific genes. This plays an important role in regulating inflammatory and autoimmune responses, cell proliferation and apoptosis.
Activation of transcription factors can be monitored by imaging as a translocation from the cytoplasm to the nucleus using antibodies for the transcription factors or fluorescent protein tags.
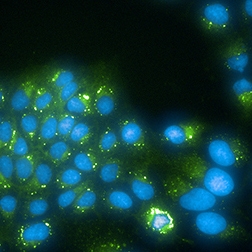
Image shows nuclear translocation of NFkB. Color overlay of the nuclear stain image (Hoechst 33342, blue channel) and labeled NFKB antibody (green channel).