IVIS SpectrumCT In Vivo Imaging System
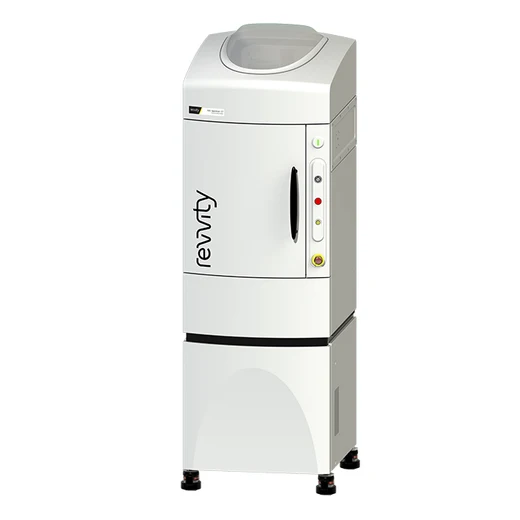


The IVIS® SpectrumCT preclinical in vivo imaging system expands upon the versatility of the IVIS Spectrum by offering 2D and 3D imaging capabilities but includes integrated low-dose microCT ideal for longitudinal studies. The system provides researchers with greater insights into complex biological systems by enabling simultaneous molecular and anatomical non-invasive imaging in animal models.
Product information
Overview
The constant horizontal gantry motion and the flat panel detector provide unparalleled performance for low-dose imaging and automated optical and microCT integration. The stable revolving animal platform table rotates 360° to acquire full 3D data. Multiple animals can be scanned simultaneously while maintaining an average dose per scan at about 13mGy, with a scanning and reconstruction time of less than a minute. Optical and microCT modalities can also operate independently.
Key features include:
- Integrated optical and microCT technology
- 3D optical tomography for fluorescence and bioluminescence
- The industry’s most sensitive detection technology ideal for:
- Bioluminescence
- Multispectral fluorescence and spectral unmixing
- Cerenkov imaging for optical radiotracer imaging
- Low dose and ultra fast microCT
- DyCE™ dynamic enhanced imaging for real time distribution studies of both fluorochromes or PET tracers ideal for PK/PD app
The IVIS SpectrumCT is an integrative platform that combines the full suite of IVIS optical features including Spectral Unmixing, 2D and 3D quantitative bioluminescence and fluorescence with fast and low dose CT imaging. The simple user interface along with automated co-registration, advanced visualization and analysis tools are driven by Revvity’s market leading Living Image® software. The IVIS Spectrum CT enables longitudinal workflows to characterize disease progression and therapeutic effect throughout the complete experimental time frame with both quantitative CT and optical reconstructions. Fast imaging and the ability to image multiple animals offers the throughput required to scan large cohorts of animals quickly and draw sound conclusions from your experimental data.
Specifications
| Height |
206.0 cm
|
|---|---|
| Portable |
No
|
| Width |
65.0 cm
|
| Brand |
IVIS
|
|---|---|
| Imaging Modality |
microCT Imaging
Optical Imaging
|
| Optical Imaging Classification |
Bioluminescence Imaging
Fluorescence Imaging
|
| Quantity in a Package Amount |
1.0 each
|
| Unit Size |
1 Unit
|
Selected Publications / Citations / References
- Jin et al (2020). A metastasis map of human cancer cell lines. Nature. 588, 331–336. https://doi.org/10.1038/s41586-020-2969-2
- Nazerai et al (2020). Effector CD8 T Cell-Dependent Zika Virus Control in the CNS: A Matter of Time and Numbers. Front. Immunol. https://doi.org/10.3389/fimmu.2020.01977
- Mason et al (2020). Imaging Early-Stage Metastases Using an 18F-Labeled VEGFR-1-Specific Single Chain VEGF Mutant. J Mol Img Biol. https://doi.org/10.1007/s11307-020-01555-z
- Gendron et al (2020). Tumor targeting vitamin B12 derivatives for X-ray induced treatment of pancreatic adenocarcinoma. Photodiagnosis Photodynamic Ther. 30, 101637.https://doi.org/10.1016/j.pdpdt.2019.101637
- Srivastan et al (2020). Highlights on the imaging (nuclear/fluorescence) and phototherapeutic potential of a tri-functional chlorophyll-a analog with no significant toxicity in mice and rats. J Photochem Photobiol. 211, 111998. https://doi.org/10.1016/j.jphotobiol.2020.111998
- Kim et al (2020). Peptide 18-4/chlorin e6-conjugated polyhedral oligomeric silsesquioxane nanoparticles for targeted photodynamic therapy of breast cancer. Colloids and Surfaces B: Biointerfaces. 189, 110829. https://doi.org/10.1016/j.colsurfb.2020.110829
- Witcomb et al (2017). Non-invasive three-dimensional imaging of Escherichia coli K1 infection using diffuse light imaging tomography combined with micro-computed tomography. Methods. 127:62-68. https://doi.org/10.1016/j.ymeth.2017.05.005
- Nielson et al (2017). Detection of local inflammation induced by repeated exposure to contact allergens by use of IVIS SpectrumCT analyses. Contact Dermititis. 74(4): 210-217.https://doi.org/10.1111/cod.12746
- Satpathy et al (2016). Targeted in vivo delivery of EGFR siRNA inhibits ovarian cancer growth and enhances drug sensitivity. Sci Reports. 6: 36518.https://doi.org/10.1038/srep36518
- Witcomb et al (2015). Bioluminescent Imaging Reveals Novel Patterns of Colonization and Invasion in Systemic Escherichia coli K1 Experimental Infection in the Neonatal Rat. Inf & Immunity. 83(12): 4528-4540. https://doi.org/10.1128/IAI.00953-15
Resources
Surfactant Protein B (SP-B) deficiency is an uncommon, autosomal recessive lung disorder in term infants. This inability to...
Non-alcoholic fatty liver disease (NAFLD) describes a progressive pathology that affects the liver. Fat accumulation causes fatty...
Instrument background occurs when excitation light leaks through the emission filter. This occurs more frequently when the...
Scientists continue to explore several options to treat SARS-CoV-2 infection with hundreds of therapeutics at various phases of...
This tech note outlines procedures on using auto-exposure on the IVIS® preclinical optical imaging platform using Living Image®...
Precision biologics are playing an increasingly powerful role as part of therapeutic strategies such as monoclonal antibodies...


How can we help you?
We are here to answer your questions.
