US
Revvity Sites Globally
Select your location.
*e-commerce not available for this region.


Columbus Image Data Storage and Analysis System
Columbus Image Data Storage and Analysis System
Columbus Software
This product has been discontinued
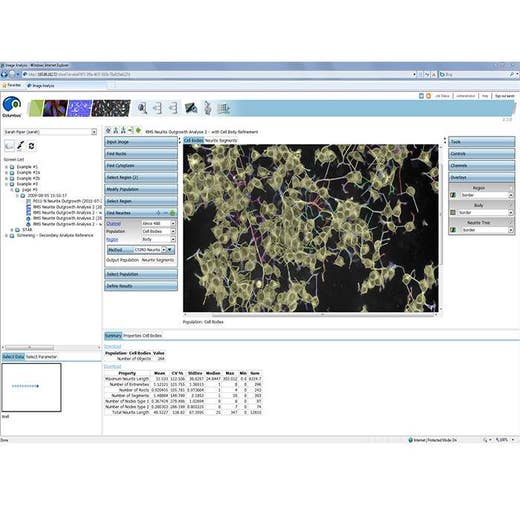
Our Columbus™ Image Data Storage and Analysis system is an instrument agnostic image analysis and management platform.
NEW! Signals Image Artist™ is our next-generation solution for image analysis and management.
Product variants
Discontinued
Brand: Columbus
Part #:
COLUMBUS
Discontinued
Brand: Columbus Plus
Part #:
COLUMBUSPLUS
For research use only. Not for use in diagnostic procedures.
Loading...
Product information
Overview
Image storage and analysis for all your high content imaging data.
High Content Screening experiments generate massive amounts of image data that needs to be accessed quickly, analyzed and re-analyzed, shared with colleagues and stored safely. With the trend towards using more complex, physiologically relevant disease models, more sophisticated tools are required to numerically describe cells and their phenotypes comprehensively. The Columbus system is the only image data storage and analysis system that supports a wide range of file formats, allowing visualization of images, regardless of their origin.
A powerful new way to access, store and explore
- Import images from any major high content imaging instrument for a single solution for data storage and analysis.
- Access, visualize, and analyze image data from the convenience of your web browser. Access the data not just from within a single lab but from across the enterprise.
- Store all image data in a central location, with associated metadata to give a complete and enduring picture of any experiment.
- Get started without extensive training – browse and explore your data using the intuitive user interface.
- Utilize pre-designed segmentation routines and feature extraction algorithms, such as STAR morphology, to perform sophisticated analysis with ease.
Image Analysis for Phenotypic Screening
- Generate statistically-significant, quantitative and multi-parametric data from your cell images for robust results.
- Includes powerful image analysis building blocks that are easy to use and have been designed to be used by researchers, not just image analysis experts
- Measure complex and subtle phenotypic responses by extracting the properties that describe the unique cellular fingerprint
- Compare multiple samples, plates or batches to quality check your results
- Relate results to concentrations with dose response curves
- Kinetic measurement capabilities enable you to measure time-resolved data and track cells to reveal changes in cell properties and provide information on cell movement
- Analyze new images or re-analyze images from past experiments using our building blocks which encapsulate our many years of experience in high content analysis
- PhenoLOGIC™ machine-learning technology allows you to easily create customized algorithms using a simple point-and-click approach
- Access your Columbus results directly in Signals Screening via the High Content Profiler app and perform screening data analysis and validation, QC analyses, calculate reliable normalization, perform multivariate hit stratification and drug response profiling.
- Columbus 2.9.1 supports MuviCyte.
Specifications
| Brand |
Columbus
|
|---|---|
| Unit Size |
1 Each
|
Resources
Are you looking for resources, click on the resource type to explore further.
Whitepaper
High content screening in three dimensions
Researchers are increasingly looking to 3D cell cultures, microtissues, and organoids to bridge the gap between 2D cell cultures...
Case Study
Phenotypic characterization of mitochondria in breast cancer cells using morphology and texture properties
Mitochondria are complex networks that are highly variable, both between cell lines and within cell populations. Reliably...
Loading...


How can we help you?
We are here to answer your questions.