US
Revvity Sites Globally
Select your location.
*e-commerce not available for this region.

Cellometer Spectrum Image Cytometry System
The Cellometer™ Spectrum image cytometer is an advanced, modular cell counter capable of running cell-based assays utilizing fluorescent reagents and kits. It can be customized for specific assays/reagents of interest.
For research use only. Not for use in diagnostic procedures.

Cellometer Spectrum Image Cytometry System
Cellometer Spectrum Image Cytometry System
Part #:
SPECTRUM-SYS1-10X
Imaging Modality:
Fluorescence, Brightfield
Loading...
Product information
Overview
The Cellometer Spectrum image cytometer is a customizable cell counting and cytometry instrument that provides flow-like data with predesigned templates.
You can quickly plot cell population data as a histogram, scatter plot, dot plot or contour plot using FCS express. The filter sets are user-changeable, allowing you to customize the instrument for specific assays/reagents of interest.
Integrated cell analysis solution
Basic cell counting, primary cell viability, and cell-based assays.
- PBMCs
- Stem Cells
- Adipocytes
- Neural Cells
- Hepatocytes
- Dendritic Cells
- Epithelial Cells
- Keratinocytes
- Lymphocytes
- Splenocytes
- Monocytes
- Yeast
- Leukocytes
- Cell Lines
- Nucleated Cells
Dual-fluorescence for accurate primary cell viability
No interference from red blood cells. Analyze bone marrow, peripheral blood, and cord blood without lysing.
User changeable fluorescence filters
Choose from six color options to run two-color assays
Unique algorithms for advanced cell analysis
Determine concentration and viability of hepatocytes, adipocytes, and other sophisticated cell types.
Fast results
Obtain cell images, counts, size measurements and viability calculations in < 30 seconds per sample.
Simple cell-based assays
- Small 20 µl sample size
- Cell count, concentration and viability
- Two-color antibody assays
- GFP/RFP Transfection
- Cell health and cell-based assays, including:
- Apoptosis
- Cell proliferation
- Cell cycle
- Mitochondrial potential
- Phagocytosis
- Surface Marker Analysis
Additional product information
Advantages of Cellometer Spectrum
View Cell Images
- Visually check cell morphology
- Ensure only cells of interest are counted
- Archive and re-analyze cell images
- Export images for publication
Proprietary Pattern-Recognition Software
- Count individual cells in clusters
- Count irregular-shaped cells
- Count cells based on size
- Eliminate debris from cell counts
Non-Fluidic Platform
- Disposable counting chambers – no washing
- Compatible with fragile cells
- Maintenance-free
- Robust optics modules and LED light sources
IQ/OQ Validation and GMP/GLP Accessories
- Installation Qualification reagents/protocol
- Operational Qualification reagents/protocol
- On-site IQ and OQ performance
- GMP/GLP Software Module
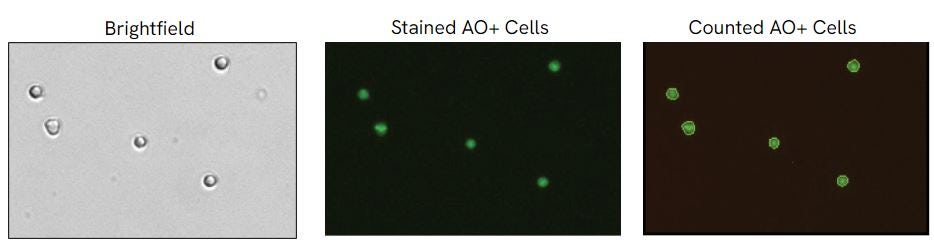
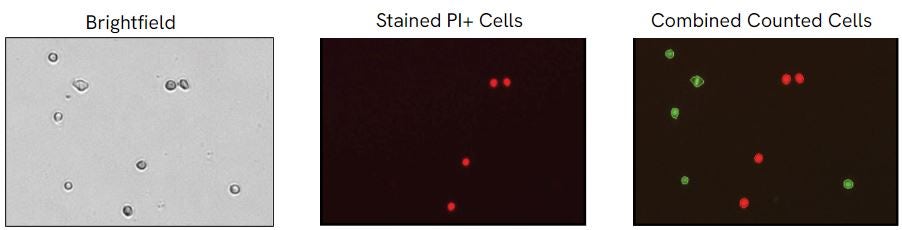
Fluorescent Cell Counting
- Automatic identification of Acridine Orange (AO) stained cells (shown above) and Propidium Iodine (PI) stained cells (shown below).
- Image and count up to 2×10⁷cells/mL
User-Changeable Fluorescence Optics Modules*
The Spectrum is designed to hold two user-changeable fluorescence optics modules. Purchase only the modules you need and easily configure the instrument by quickly changing the colors to fit your experimental design.
| Optics Module | Fluorophores | Nucleic Acid Stains | Fluorescent Proteins and other Fluorescent Cell Reagents |
|---|---|---|---|
| S1-452-365 Ex. 370 nm (BW: 36 nm) Em: 452 nm (BW: 45 nm) |
BV421 V450 Pacific Blue |
Hoechst 33342 DAPI ViaStain™ Dead Cell Nuclear Blue |
Calcein AM Violet CTV (CellTrace Violet) Tracer Blue BFP |
| S1-534-470 Ex: 475 nm (BW: 42 nm) Em: 534 nm (BW:42 nm) |
FITC AlexaFluor® 488 |
AO (acridine orange) SYTO®9, SYTO®13 SYTOX®Green SYTO®BC |
GFP YFP Calcein AM CFSE JC-1 |
| S1-594-470 Ex. 475 nm (BW: 42 nm) Em: 594 nm (LP - Long Pass) |
Chlorophyll A Chlorophyll B |
||
| S1-605-527 Ex: 525 nm (BW: 45 nm) Em: 605 nm (BW: 64 nm) |
AlexaFluor® 546 AlexaFluor® 555 Cy3® PE (R-phycoerythrin) RFP |
PI (propidium iodide) EB (ethidium bromide) SYTOX® Orange |
RFP mCherry TdTomato TurboRed TMRE/TMRM JC-1 |
| S1-655-527 Ex: 525 nm (BW: 45 nm) Em: 655 nm (BW: 40 nm) |
PI (propidium iodide) EB (ethidium bromide) 7-AAD |
Nile Red | |
| S1-692-620 Ex: 628 nm (BW: 40 nm) Em: 692 nm (BW: 40 nm) |
AlexaFluor® 647 APC (allophycocyanin) Cy5® |
SYTOX® Red | iRFP670 CellTrace Far Red Cell Tracker Deep Red LysoTracker Deep Red |
*This table is a partial list of compatible fluorophores, nucleic acid stains, and fluorescent proteins. Please contact Revvity technical support regarding compatibility of other reagents. Sytox, AlexaFluor, and Cy are trademarks of Life Technologies.
Cellometer Spectrum Specifications
| Includes |
|
|---|---|
| Magnification selection |
|
| Instrument specifications |
|
| Available accessories |
|
| Imaging performance |
|
Specifications
| Dimensions | 6.0 in (W) x 8.5 in (D) x 14.0 in (H) |
|---|---|
| Weight |
10.9 kg
|
| Brand |
Revvity
|
|---|---|
| Imaging Modality |
Fluorescence, Brightfield
|
| Model |
Cellometer Spectrum image cytometry system
|
| Technology |
Cellometer Software
|
| Unit Size |
1 each
|
Citations
Resources
Are you looking for resources, click on the resource type to explore further.
eBook
10 key factors to improve your cell counting results
Cell counting plays a crucial role in the development and manufacturing of cell and gene therapies as well as regenerative...
Application Note
A novel method for T-cell immunophenotyping using the Cellometer Spectrum image cytometer.
Brochure
Automated cell counting and image cytometry solutions brochure
With expertise and a pioneering spirit, Revvity boldly leads the way in cell imaging and analysis. As creators of advanced...
Application Note
Comparison of trypan blue vs acridine orange propidium iodide staining methods
The application note showcases a time-course study that compares cellular viability measured with trypan blue and acridine orange...
Loading...


How can we help you?
We are here to answer your questions.