


3D Cell Model Imaging & Analysis Image Gallery
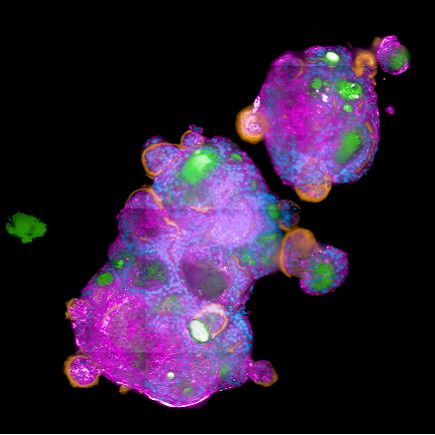
SARS-CoV-2-infected apical-out polarized lung organoids. Stained using Hoechst for nuclei (blue), MUC5AC for mucus (orange), phalloidin for tight junctions (pink), and an anti-SARS-CoV-2 antibody (green). Kindly provided by D.Wilfingseder, A.Noureen Institute of Hygiene and Medical Microbiology, Medical University of Innsbruck, Austria.
Spheroid location using PreciScan. A pre-scan at low magnification (5x) was first used to locate where spheroids have grown, followed by an automatic rescan at higher magnification (40x) with the spheroid centered in the image. Image acquired on an Opera Phenix high-content screening system.
Maximum intensity projection image (20xW) of InSphero human liver microtissue treated with FCCP (affects the hepatobilary transporter activity in these microtissues) and stained with TMRM, imaged on the Opera Phenix™ high-content screening system. FFCP is a known mitochondrial toxin and therefore reduces the TMRM intensity.
Maximum intensity projection image (20xW) of InSphero human liver microtissue treated with FCCP (affects the hepatobilary transporter activity in these microtissues) and stained with Hoechst, imaged on the Opera Phenix high-content screening system.
Maximum intensity projection image stack with 300 planes and 1 µm plane distance. Image acquired on an Opera Phenix system using a 20x water immersion objective.
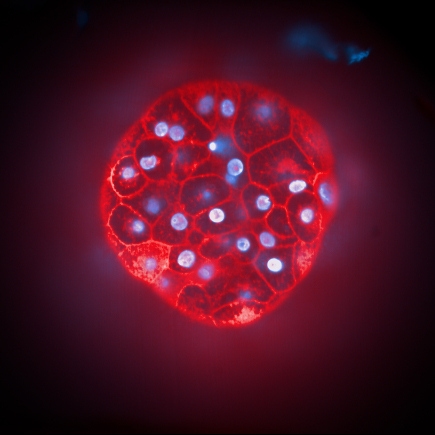
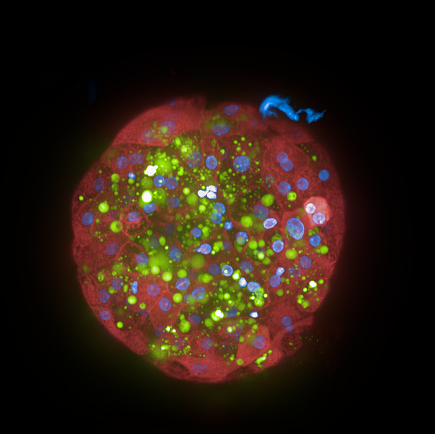
Human Liver Microtissues from InSphero labeled with Hoechst (nuclei, blue) and CellMask™ Deep Red plasma membrane stain.
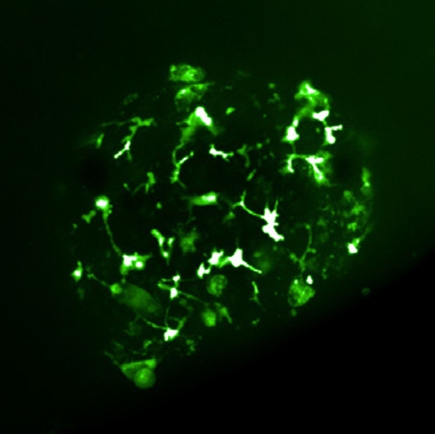
Maximum intensity projection image (20xW) of InSphero human liver microtissue stained with TMRM, imaged on the Opera Phenix high-content screening system.
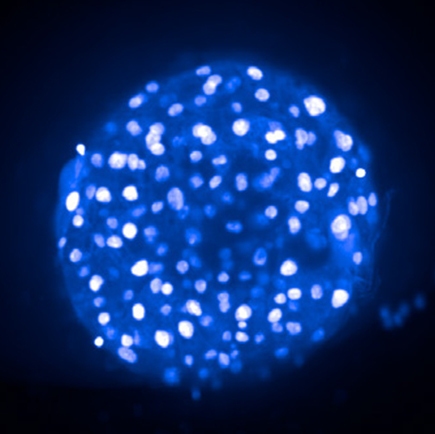
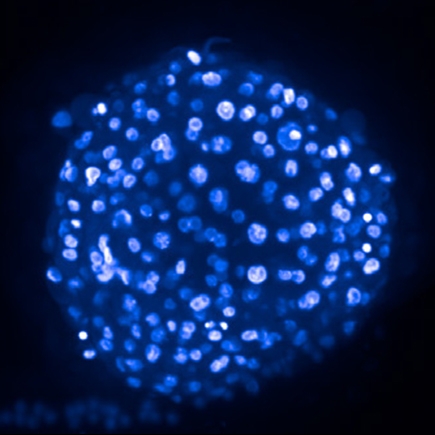
Maximum intensity projection image (20xW) of InSphero human liver microtissue stained with Hoechst, imaged on the Opera Phenix high-content screening system.
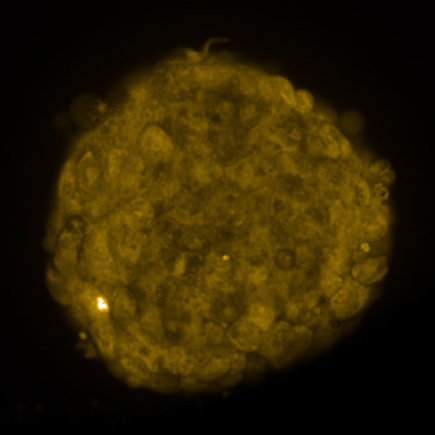
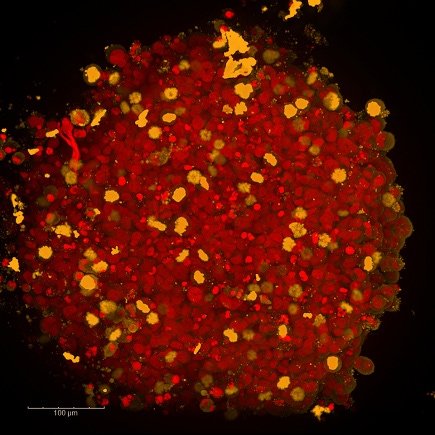
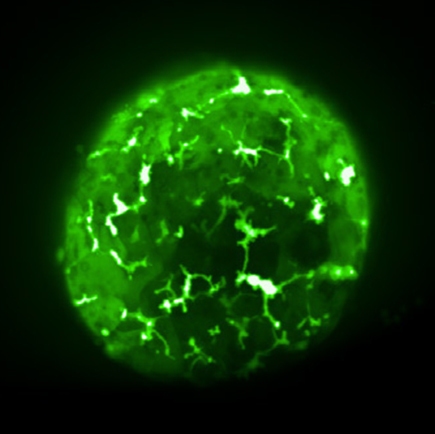
Maximum intensity projection image (20xW) of InSphero human liver microtissue stained with CLF, imaged on the Opera Phenix high-content screening system.
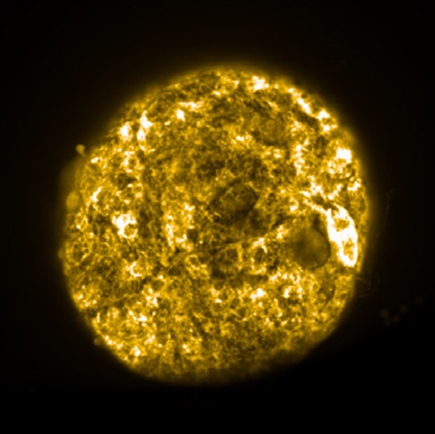
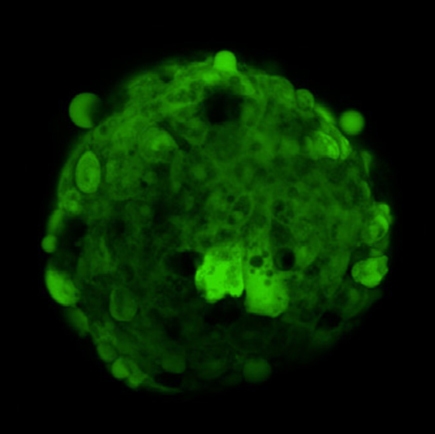
Maximum intensity projection image (20xW) of InSphero human liver microtissue stained with CMFDA, imaged on the Opera Phenix high-content screening system.
Maximum intensity projection image (20xW) of InSphero human liver microtissue treated with FCCP (affects the hepatobilary transporter activity in these microtissues) and stained with CMFDA, imaged on the Opera Phenix high-content screening system.
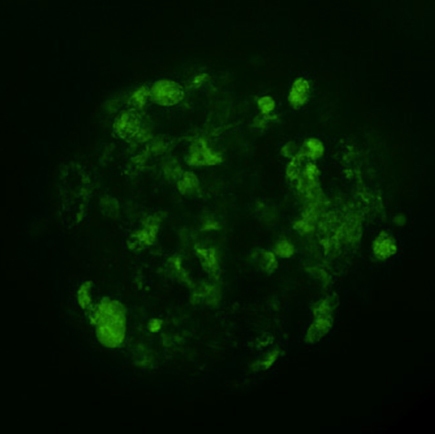
Maximum intensity projection image (20xW) of InSphero human liver microtissue treated with FCCP (affects the hepatobilary transporter activity in these microtissues) and stained with CLF, imaged on the Opera Phenix high-content screening system.
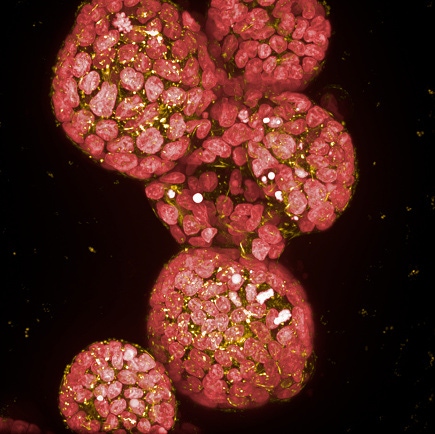
MDCK cysts cultured in 2% Geltrex in CellCarrier Ultra ULA-coated 384 well microplates, labeled with DRAQ5™ and Rhodamine Phalloidin. Maximum Intensity Projection acquired on the Operetta CLS system.
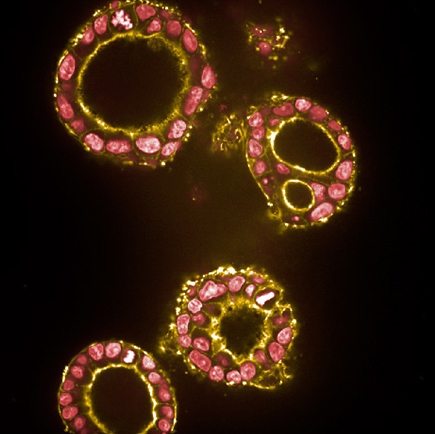
MDCK cysts cultured in 2% Geltrex in PhenoPlate ULA-coated 384 well microplates, labeled with DRAQ5 and Rhodamine Phalloidin. Single Plane image acquired on the Operetta CLS system.
Cyst in 3D rendered by Harmony software and segmented with the “Find cytoplasm” Building Block. For each detected object in each available channel, different features like intensity, morphology, and texture can be calculated either for the whole or custom-defined areas of the object.
Cyst in 3D rendered by Harmony software and segmented with the “Find nuclei” Building Block. For each detected object in each available channel, different features like intensity, morphology, and texture can be calculated either for the whole or custom-defined areas of the object.
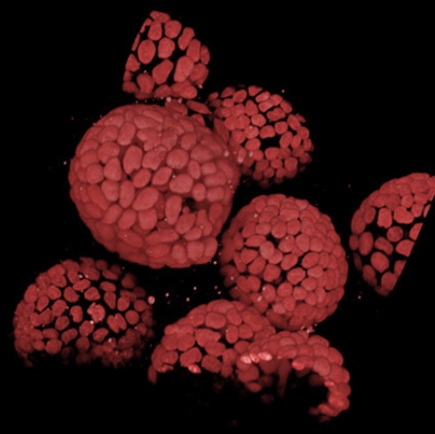
Cyst in 3D rendered by Harmony software.
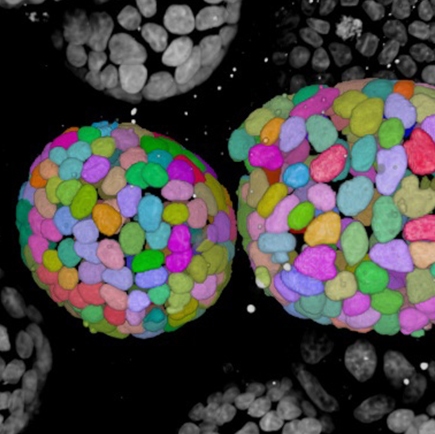
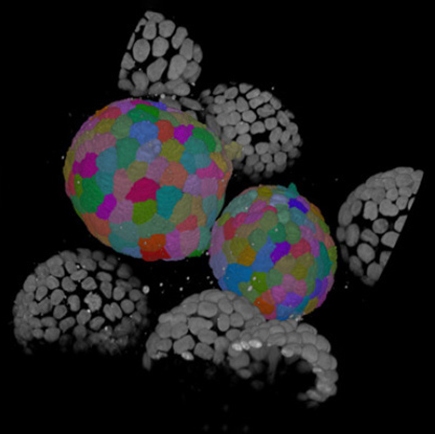
MDCK cysts, nuclei segmented and displayed in color by Harmony software.
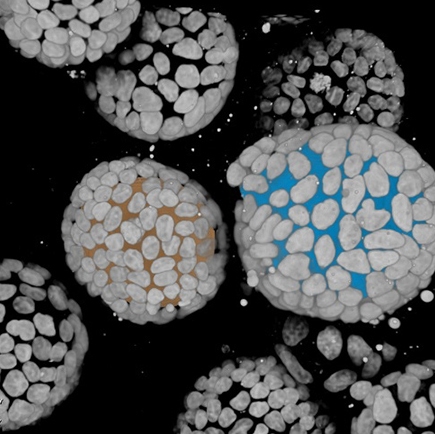
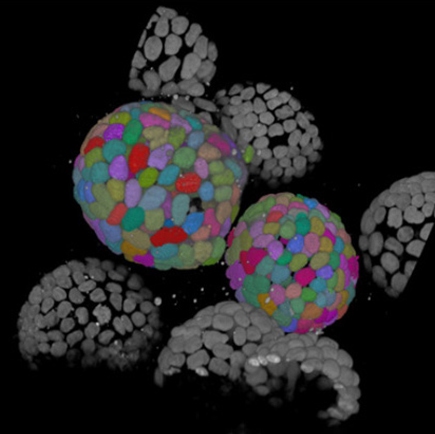
MDCK cysts, lumen segmented and displayed in color by Harmony software.