US
Revvity Sites Globally
Select your location.
*e-commerce not available for this region.


Cellometer Auto 2000 Cell Viability Counter
This product has been discontinued
As of January 1, 2025 the Cellometer™ Auto 2000 is no longer available for sale. Please consider the Cellometer™ Ascend™ automated cell counter.
For research use only. Not for use in diagnostic procedures.
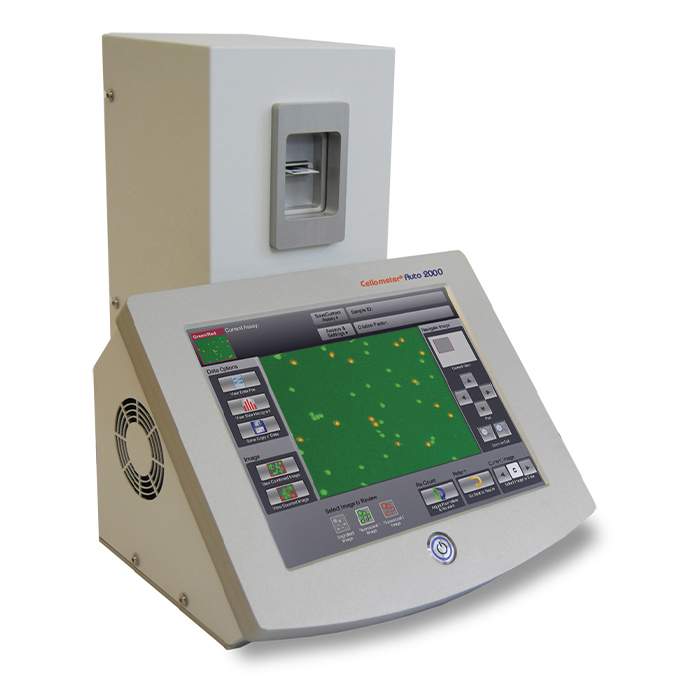
Cellometer Auto 2000 Cell Viability Counter
Cellometer Auto 2000 Cell Viability Counter
Discontinued
Part #:
CMT-A2K
Imaging Modality:
Fluorescence, Brightfield
Loading...
Product information
Overview
As of January 1, 2025 the Cellometer™ Auto 2000 is no longer available for sale. Please consider the Cellometer™ Ascend™ automated cell counter.
The Cellometer Auto 2000 enables users to:
- Increase throughput
- Increase accuracy
- Improve consistency
- Count difficult cells (clumpy, irregular-shaped)
- Minimize judgment errors, miscounts, interference from red blood cells and user-to-user variability
Additional product information
Primary cell analysis: PBMCs, stem cells, and more
The Cellometer Auto 2000 performs analysis of primary cells from peripheral blood, cord blood, bone marrow, and other complex samples for use in a wide range of research areas, including:
- Nucleated cells for transplantation
- PBMCs for immunology
- Splenocytes for vaccine development
- Stem cells for cellular therapy
- Tumor cell suspensions for oncology
Dual-color fluorescence allows for staining of live and dead nucleated cells, generating accurate viability results even in the presence of debris, platelets, and red blood cells. Accurate analysis of both ‘messy’ and 'clean' samples enables the Cellometer Auto 2000 to evaluate samples at a variety of points throughout sample processing - from initial collection to separation, to cryopreservation.
One-touch assays for analysis of a wide range of primary samples, including:
Nucleated cells from whole blood
Stem cells
PBMCs / Splenocytes following separation
Tumor and tissue cell suspension
Reduced interference from red blood cells, platelets, or debris
The dual-fluorescence AO/PI method utilizes nuclear staining dyes that bind to nucleic acids in the cell nucleus. Because most mature mammalian red blood cells do not contain nuclei, only live and dead mononuclear cells produce a fluorescent signal. There is no need to lyse red blood cells, saving time and removing an extra sample preparation step. Red blood cells, platelets, and debris are not counted in the fluorescent channels.
The advantage of fluorescent counting for primary cells
These images (right) demonstrate the advantage of fluorescent counting for primary cells. The brightfield image shows the combination of nucleated cells, red blood cells, and platelets present in the sample. Only the live and dead nucleated cells are visualized and counted in the green and red fluorescent channels.
| Sample | Measurement | Total nucleated | All | RBC | % RBC | n |
|---|---|---|---|---|---|---|
| PBMC+RBC |
Mean CV |
1.26E+07 6.2% |
1.39E+07 8.8% |
1.23E+06 | 8.9% | 10 |
| PBMC+1/2RBC |
Mean CV |
1.21E+07 4.8% |
1.27E+07 5.4% |
5.82E+05 | 4.6% | 10 |
| PBMC+1/4RBC |
Mean CV |
1.22E+07 7.9% |
1.24E+07 7.3% |
2.27E+05 | 1.8% | 10 |
Fresh human PBMCs (peripheral blood mononuclear cells) were spiked with varying amounts of RBCs (red blood cells.) All cells (nucleated + RBC) were counted in the brightfield channel. Nucleated cells were then counted in the green fluorescent channel. Varying amounts of RBCs (1.8%, 4.6%, and 8.9%) did not affect the nucleated cell count.
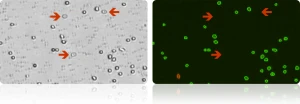
Several red blood cells are indicated in the brightfield image (above, left). The red blood cells are not visible in the fluorescent image (above, right) detecting cells stained with nuclear staining dye.
Live / dead nucleated cell counts using dual-fluorescence
Why dual-fluorescence?
Because brightfield cell counting does not differentiate nucleated from non-nucleated cells and trypan blue staining is not as easy to detect as fluorescent staining, dual-color fluorescence is strongly recommended for accurate viability analysis for primary cells. The Auto 2000 is equipped with standard assays for dual-fluorescence analysis of primary cells stained with AO/PI.
The AO/PI method
Acridine Orange, AO, is a nuclear staining (nucleic acid binding) dye permeable to both live and dead cells. It stains all nucleated cells to generate green fluorescence. Propidium iodide, PI, can only enter dead cells with compromised membranes. It stains all dead nucleated cells to generate red fluorescence. Cells stained with both AO and PI fluoresce red due to quenching, so all live nucleated cells fluoresce green and all dead nucleated cells fluoresce red.
Green fluorescent live cell image

Red fluorescent dead cell image

Cellometer precision
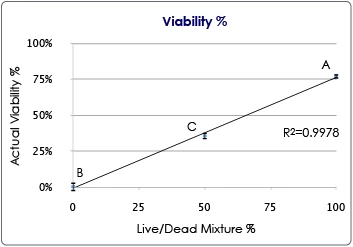
The Cellometer Auto 2000 offers excellent reproducibility, with a %CV (Coefficient of Variation) of <10% for fluorescent concentration and viability measurements. The data (below) is based on four preparations of Jurkat cells stained with propidium iodide, a fluorescent nuclear-staining dye.
| Sample | N value | Average live cell concentration | % viability | CV of concentration | CV of viability |
|---|---|---|---|---|---|
| A | 4 | 4.20E+06 | 91.1 | 10% | 2% |
| B | 4 | 1.06E+06 | 22.7 | 7% | 1% |
| C | 4 | 3.27E+06 | 57.5 | 7% | 7% |
Cell line total cell concentration
The results indicate the accuracy of the Cellometer Auto 2000 instrument cell concentration. Serial dilutions (2-, 4-, and 8-fold) were prepared using PBS and Jurkat cells. Four measurements were performed for each sample and the averages were calculated and plotted. A linear correlation between the concentration measurements and 1/dilution factor was observed. The results show the reliability and accuracy of the Cellometer Auto 2000 in measuring cell concentration.
Jurkat cell concentrations at various sample dilution factors. N=4. Error bars correspond to the Standard Deviations for cell concentration.
| Sample | Dilution factor | Average cell concentration | CV of concentration | Standard deviation | N value |
|---|---|---|---|---|---|
| A | 1 | 5.80E+06 | 1% | 4.8E+04 | 4 |
| B | 2 | 3.39E+06 | 2% | 8.12E+04 | 4 |
| C | 4 | 1.63E+06 | 6% | 9.54E+04 | 4 |
| D | 8 | 8.27E+05 | 6% | 5.33E+04 | 4 |
Table of results for total cell concentration for the Cellometer Auto 2000 instrument.
Specifications for Cellometer Auto 2000 cell viability counter
| Includes |
Cellometer Auto 2000 instrument with integrated computer and touch-screen and dual-fluorescent optics Cellometer software Two USB 2.0 ports Power supply Ethernet port Phone/online applications support during set-up |
|---|---|
| Imaging performance |
Cell Size: 5 - 300* microns Conc. Range: 105 – 107 cells/ml brightfield imaging, fluorescent imaging and pattern-recognition software to quickly and accurately decluster, identify and count individual cells. *Cellometer CHT4-PD300 Slides are required for cells > 80 microns in diameter |
| Instrument specifications |
Weight: 26 lbs. (11.8 kg) Dimensions: Width: 11.1″ (28.3 cm) Depth: 12.8″ (32.4 cm) Height: 13.4″ (34.0 cm)Input to Power Adapter: 100-240 VAC, 50/60 Hz, 1.5A Output to instrument: 12 VDC, 7.5A |
| Display | 10.4″ touch screen |
| Fluorescent optics |
Excitation / Emission: 470 nm/535 nm Example fluorophores:
Excitation / Emission: 540 nm/605 nm Example fluorophores:
|
Specifications
| Brand |
Cellometer
|
|---|---|
| Imaging Modality |
Fluorescence, Brightfield
|
| Unit Size |
1 each
|
Resources
Are you looking for resources, click on the resource type to explore further.
Whitepaper
Exploring factors impacting and improving cell counting precision
Cell counting precision is a critical parameter for determining the overall quality of cell counting results. Many factors...
Whitepaper
History of immunotherapy and CAR T-cells
One of the most promising fields in cancer research is immunotherapy – manipulating the existing immune system to specifically...
Whitepaper
Identifying and resolving the sources of hemacytometer counting error through automation
The hemacytometer is an integral part of all cell-based research, and yet sources of error inherent in its design and utilization...
Application Note
Isolation, quantitation and viability analysis of neonatal cardiomyocytes using the Cellometer Auto 2000 cell viability counter.
Application Note
Measuring concentration and viability of PBMCs without lysing using the Cellometer Auto 2000 cell counter.
Loading...


How can we help you?
We are here to answer your questions.