


The Celigo™ image cytometer
 Celigo Image Cytometer
was used to rapidly image entire wells in a 96-well plate using brightfield during several protocol steps for a luciferase assay. The brightfield images are automatically analyzed to quantify the confluence percentage in each well.
Celigo Image Cytometer
was used to rapidly image entire wells in a 96-well plate using brightfield during several protocol steps for a luciferase assay. The brightfield images are automatically analyzed to quantify the confluence percentage in each well.
- Target cells are seeded per well
- The plate is imaged and analyzed using Celigo to ensure uniform seeding density
- The plate is then incubated overnight for cell adherence
- Next, the Celigo is used to image and measure confluence percentages for each well to ensure uniformity before AAV transduction and luciferase measurement
High-throughput label-free cell confluence measurement
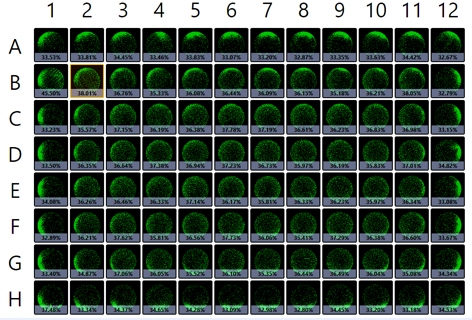
The captured whole-plate view indicates cell confluence with a pseudo-color green in Figure 1a, and the confluence results are displayed in Figure 1b. In this experiment, whole-well imaging performed at the time of transduction revealed consistent measurements across wells, but confluence was markedly lower at 35% than the expected 50%. The results also showed slightly higher confluence percentages in the interior wells.
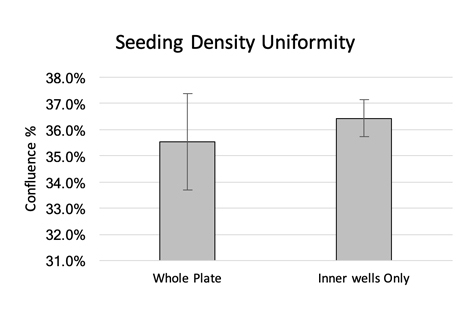
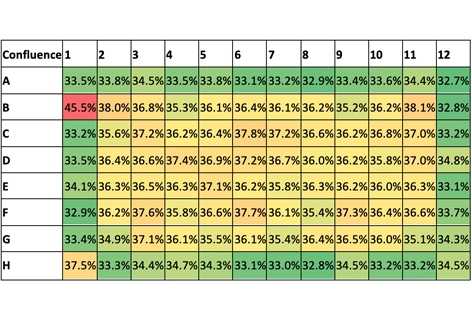
Figure 1. (a) Whole-plate view with pseudo-color green fill indicating areas of cell confluence in the wells. (b) Confluence percentages generated using Celigo where the gradient colors represent higher (red) and lower (green) confluence percentages. (c) Comparison of the average confluence percentages across the whole plate versus the data for the inner wells only.
Whole-well imaging enables identification of non-uniform cell seeding
The second whole-plate image depicts the phenomenon of pronounced non-uniform cell seeding with higher density at the edge walls (Figure 2). The center inset shows cells that are more dispersed compared to the wells in the top and bottom insets. This example underscores the importance of imaging the entirety of every cell, in every well for the entire plate as this impacts the data and overall quality of results.
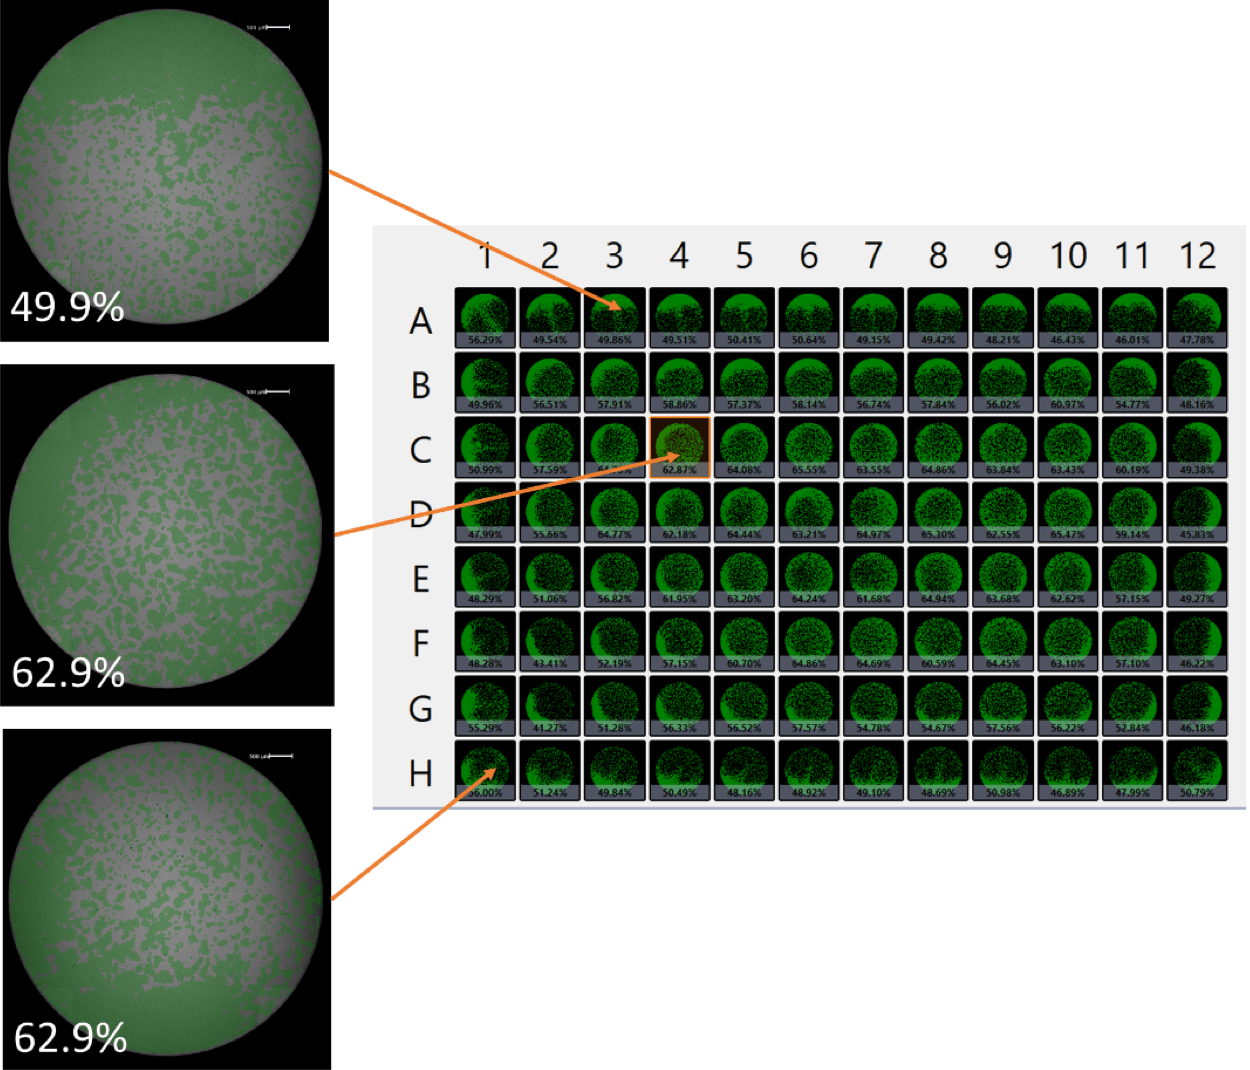
Figure 2. Whole-plate view showing cell confluence for each well. Cell seeding uniformity can vary at different locations of the plate.
These examples show noticeable variations in label-free confluence measurements among wells, with larger differences along plate edges. Understanding cell growth kinetics and intraplate differences enable researchers to:
- Minimize variability within experiments from well-to-well
- Improve consistency among experiments from plate-to-plate
- Optimize subsequent AAV transduction steps that require a specific confluence
You may also be interested in these products


Part number:
200-BFFL-5C

Part number:
CS2-0106-5ML,
CS2-0106-25ML
List price:
USD 136.00 - USD 606.00
Login to view
your price
")
List price:
USD 292.00 - USD 5,366.00
Login to view
your price
")
List price:
USD 292.00 - USD 5,366.00
Login to view
your price
of 5
For research use only. Not for use in diagnostic procedures.