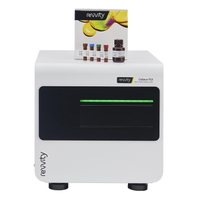
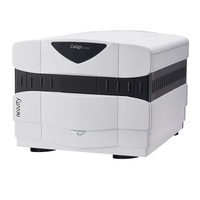
In this experiment, the Celigo™ Image Cytometer
 Celigo Image Cytometer
was used to image and quantify lentiviral-GFP transduction efficiencies in 96-well plates at different Multiplicity of Infections (MOIs).
- HEK293T cells were seeded in a 96-well plate and incubated overnight to reach 80% confluency
- The cells were then transduced with five different viral amounts (1, 0.1, 0.01, 0.001, 0.0001 mL) and incubated to express GFP
- The Celigo was used to image and analyze the cells in brightfield and green fluorescence to measure transduction efficiencies at different MOIs.
- The software automatically identified and segmented cells to provide counts of both total cells and GFP+ cells
Dose-dependent measurement GFP+ percentages indicating lentiviral transduction efficiencies
The results showed a dose-dependent response in respect to GFP+ percentages shown in the brightfield and fluorescent images in Figure 1.
- GFP+ cells increased as the volume of viral particles increased (Figure 1)
- AAV-B showed higher gene expression over time in comparison to AAV-D (Figure 2)

Figure 1. Brightfield and fluorescent images of HEK293T cells transduced by the lentivirus showing greater GFP fluorescence as virus volume increased.

Figure 2. The dose-dependent curve of GFP+ percentages with respect to virus volume indicating the transduction efficiencies of the lentivirus.
You may also be interested in these products
For research use only. Not for use in diagnostic procedures.


