


Introduction to Peripheral Blood Mononuclear Cells (PBMCs)
Working with peripheral blood mononuclear cell (PBMC) samples can be tricky. Many users currently use a hemocytometer and light microscopy to manually count their PBMCs. However, standard light microscopy cannot consistently distinguish between leukocytes and red blood cells (RBCs). As a result, this manual method can result in an over-reported concentration and viability determination of the sample. Additionally, the biconcave shape of RBCs can only be identified with a special optical setup, focusing technique and trained operator. Another challenge tends to be a wide variation from sample to sample in the degree of RBC and platelet contamination.
Brightfield image
Wide variation in samples
From sample to sample, the degree of RBC and platelet contamination varies, thus making it difficult to have one set of conditions to count and measure viability quickly and simply.

Importance of accurate counts and viability
Peripheral blood mononuclear cells are used to measure immunological functions. Assays include proliferation, cytotoxicity and cytokine production. The use of cryopreserved PBMCs is critical both in clinical trials and biomedical research.
In cancer immunotherapy, leukapheresis is often used to isolate immune system cells from a donor’s blood. Cells are then expanded and exposed to different agents depending on the therapy design. Active cells are then infused back to the subject. Cell concentration and viability are essential parameters to monitor throughout the manufacturing process.
Ficoll is routinely used to isolate mononuclear cells from bone marrow, peripheral blood, and umbilical cord blood. Monocytes and lymphocytes form a buffy coat under a layer of plasma. Cells are collected and washed. Typically, some residual platelets or red blood cells are mixed in the mononuclear cells.
The functional assays on cryopreserved PBMCs are associated with viability of the cells.
Characteristics of PBMC experiments:
- Cell quality degrades with time
- Large number of samples
- Cell samples are not pure, separation quality depends on patient sample and operator
Live PBMC concentration and viability are routinely measured for cell separation, processing and cryopreservation
- Label magnetic beads for cell separation
- Antibody labeling and staining for fluorescent active cell sorting and analysis
- Cryopreservation before adding cryo-cocktail
- Quality control after thawing
Method to reduce red blood cell induced counting error
Identification of residual RBC in fresh human PBMC samples for research studies
Method:
Image samples using a fluorescent Cellometer™
 Cellometer Ascend Automated Cell Counter
automated cell counter and manually count RBC and leukocytes
Cellometer Ascend Automated Cell Counter
automated cell counter and manually count RBC and leukocytes
Procedure:
- Pipette 20 µl of fresh sample into a Cellometer disposable cell counting chamber
- Set up Cellometer with brightfield only imaging method
- Adjust focus to identify the biconcave morphology of the red blood cells
- Capture cell images from 4 locations of the counting chamber
- Print out cell images
- Manually enumerate cells with and without biconcave morphology. Platelets are not counted, as indicated by the much smaller cell size.
Residual presence of red blood cells in a PBMC sample post RBC lysis
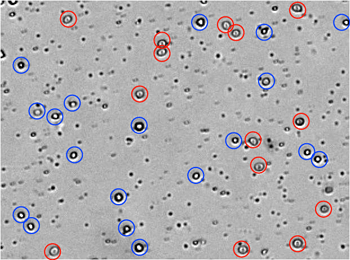
From the captured brightfield image: manual identification of RBCs (circled in red) and white blood cells (circled in blue). These residual RBCs can lead to an inaccurate count during manual counting of PBMC samples.
Results for 15 fresh human PBMC samples:
- 4 samples showed a high degree of RBC contamination (Greater than 30%)
- 6 samples showed a moderate degree of RBC contamination (10% to 30%)
- 5 samples showed low or no RBC contamination (Less than 10%)
RBC contamination % = RBC count / Total cell count (x100)
Data of RBC contamination in 15 PBMC samples
Number of cells with and without bi-concave morphology for 15 fresh human PBMC samples. This clearly shows that the amount of residual RBC varies from sample to sample, ranging from 0% to 50%.
Dual-fluorescence analysis of PBMC samples without lysing of RBCs
Revvity has optimized a dual-fluorescence staining method for simple and reliable determination of concentration and viability for use in research studies. Samples stained with AO/PI can be analyzed with the Cellometer Auto 2000, Cellometer K2 and Cellometer Ascend instruments using pre-optimized settings for PBMC analysis.
Acridine orange (AO) and propidium iodide (PI) are fluorescent nucleic acid stains that have been used to measure nucleated cell viability in various cell types, including mammalian cell lines, mammalian primary cells, and yeasts.
- AO is a membrane-permeable dye that stains nucleated viable cells green.
- PI is a membrane-impermeable dye that stains membrane compromised (non-viable) nucleated cells red.
- The non-viable cells are stained by both AO and PI. Due to fluorescent resonance energy transfer (FRET), the AO fluorescent energy is transferred to PI, allowing non-viable cells to only fluoresce red.
AO/PI-stained sample without RBC lysis
| Live PBMC | Dead PBMC | RBC/Platelet | |
|---|---|---|---|
| Acridine Orange (AO) staining | Positive green stains | Positive green stains | No stain/No stain |
| Propidium Iodide (PI) staining | No stain | Positive red stain | No stain/No stain |
Because platelets and mature red blood cells do not have a nucleus, they are not stained by nuclear staining dyes.
With the dual-fluorescence method, there is no counting error from RBCs, platelets, or debris. Lysis of RBCs is not necessary.
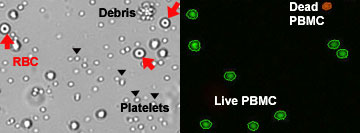
While the brightfield image shows the presence of RBC, they were not stained or counted by the Cellometer software
Validation of AO/PI dual staining method for total nucleated cell count in research studies
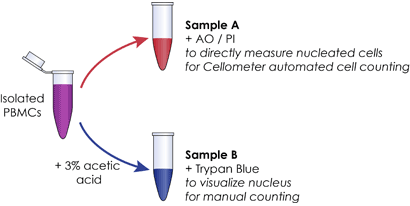
A. Directly measure total nucleated cells using AO/PI staining and Cellometer automatic cell counter
- Stain sample with AO/PI at 1:1 ratio
- Load 20 µl stained cell sample into the counting chamber
- Count and analyze PBMC sample using a fluorescent Cellometer cell counter
B. Count isolated PBMCs from sample
- Lyse the same sample using 3% acetic acid for 15 min to remove RBC contamination
- Stain cells with Trypan blue (TB)
- Manually count Trypan blue-stained cells under an optical microscope using hemocytometer
Sample preparation
C. Compare total number of Trypan-stained cells to directly measured nucleated cells using AO/PI
Samples were counted. Results showed comparable counts between AO/PI stained PBMCs and the Trypan blue stained cells after RBC lysis, indicating AO/PI does not stain RBCs and therefore can be used to stain and count PBMCs.
Counting results

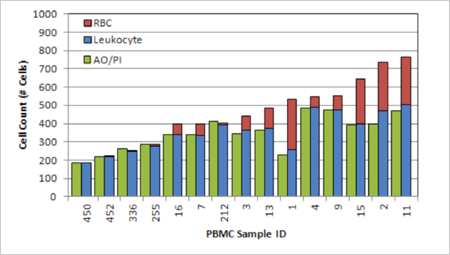
Comparison of PBMC count in a research study using AO/PI method with manual leukocyte count
A. Directly measure total nucleated cells using AO/PI staining and Cellometer automatic cell counter
- Stain fresh human sample with AO/PI (20 µl cell sample + 20 µl AO/PI)
- Count and analyze sample using a fluorescent Cellometer cell counter
- Record the AO/PI cell count and sample ID
- Compare AO/PI to leukocyte count reported in Figure 2
B. Compare AO/PI cell count to RBC and Leukocyte count performed earlier.
Results
Comparable leukocyte counts are obtained between AO/PI and manual counting for all the samples. (Same length green bar and blue bar)
The difference between cell count using the manual method and the AO/PI method equals the amount of RBCs for each sample.
The data shows that AO/PI staining can reduce the error induced by residual RBCs in the manual counting method.
Comparable leukocyte counts between AO/PI and manual counting
AO/PI assay performance – Counting range, repeatability and consistency
Measure cell concentration linearity and consistency using fresh PBMC
- Produce sample with serial dilution using PBS
- Stain sample at each dilution with acridine orange and propidium iodide mixture (=AO/PI))
- Load 20 Cellometer counting chambers for each dilution
- Measure live / dead cell concentration and viability using a fluorescent Cellometer cell counter
- Measured from live cell concentration of 2×10⁵ to 2×10⁷.
- Coefficient of variation ranged from 3.5% to 14.1%, which are in the acceptable range.
PBMC dilution series showed linearity of R2 = 0.9991
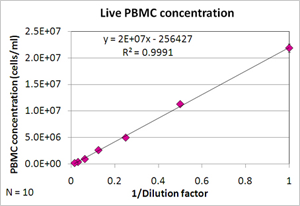
PBMC dilution series results
| Dilution factor | Live (cells/ml) | Std (n=10) | %CV |
|---|---|---|---|
| 1 | 2.2E+07 | 7.6E+05 | 3.5 |
| 0.5 | 1.1E+07 | 3.4E+05 | 3.0 |
| 0.25 | 5.0E+06 | 2.4E+05 | 4.8 |
| 0.125 | 2.6E+06 | 1.6E+05 | 6.2 |
| 0.0625 | 9.7E+05 | 5.3E+04 | 5.4 |
| 0.03125 | 4.1E+05 | 5.6E+04 | 13.9 |
| 0.015625 | 2.1E+05 | 2.9E+04 | 14.1 |
Time-course measurement of fresh PBMC viability using AO/PI
Fresh sample was stored at 4°C. At day 1, day 4 and day 7, cell sample was removed for viability measurement at each time point, using the following procedure:
- Stain cells with acridine orange and propidium iodide mixture (AO/PI)
- Load 20 Cellometer counting chambers for each dilution
- Measure viability using a fluorescent Cellometer cell counter
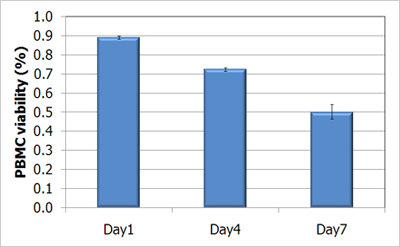
When fresh PBMCs sample was stored in 4°C, viability was reduced with storage time.
Choosing the right cellometer for PBMC cell counting in your research study
Dual-fluorescence analysis is a superior PBMC cell counting method that produces simple, reliable results when used with an automated cell counter.
The Cellometer Auto 2000 Cell Viability Counter , Cellometer K2 , Cellometer Spectrum Image Cytometry System, Cellometer Ascend and the Cellaca MX can perform analysis of PBMCs in samples with RBC contamination both pre- and post-cryopreservation. All systems can also be used to determine TNC concentration and viability in fresh blood samples prior to Ficoll separation.
| Cellometer Auto T4 | Cellometer Auto 2000 | Cellometer K2 | Cellometer Ascend | Cellometer Spectrum | |
|---|---|---|---|---|---|
| Cultured PBMCs – no debris | + | ++ | ++ | ++ | ++ |
| Cultured PBMCs – debris | + | ++ | ++ | ++ | ++ |
| Fresh PBMCs w/ lysing of RBCs | + | ++ | ++ | ++ | ++ |
| Fresh PBMCs without lysing | - | ++ | ++ | ++ | ++ |
| Frozen PBMCs | + | ++ | ++ | ++ | ++ |
++ = excellent, + = good, - = not recommended,
Conclusion
Current PBMC enumeration method using a hemocytometer and light microscopy can include donor-dependent RBC-induced counting error.
The Cellometer
Cellometer Ascend Automated Cell Counter
image cytometer was used to remove the RBC-induced counting error by automatically enumerating AO/PI-stained nucleated cells.
Reference
Chan, L.L., Wilkinson, A.R., Paradis, B.D. and Lai, N. (2012b) Rapid Image-based Cytometry for Comparison of Fluorescent Viability Staining Methods. Journal of Fluorescence 22, 1301-1311.
You may also be interested in these products

Part number:
CMT-ASD

Part number:
CS2-0106-5ML,
CS2-0106-25ML
List price:
USD 136.00 - USD 606.00
Log in to view
your online price

Part number:
ASD-CHM8-001,
ASD-CHM8-002
List price:
USD 993.00 - USD 4,413.00
Log in to view
your online price

Part number:
ASD-CHM3-001,
ASD-CHM3-002
List price:
USD 442.00 - USD 1,931.00
Log in to view
your online price
of 4
For research use only. Not for use in diagnostic procedures.