


The Celigo™ image cytometer
 Celigo Image Cytometer
simplifies required experiments in determining the vector amount to transduce as well as the post-transduction time point with maximal expression. The platform rapidly images and analyzes the fluorescence of GFP-tagged AAV vector-transduced target cells in 96-well plates.
Celigo Image Cytometer
simplifies required experiments in determining the vector amount to transduce as well as the post-transduction time point with maximal expression. The platform rapidly images and analyzes the fluorescence of GFP-tagged AAV vector-transduced target cells in 96-well plates.
- Target cells are seeded in each well of a 96-well plate and incubated overnight
- The cells are then transduced with six types of AAV-GFP vectors at high, medium, and low MOIs
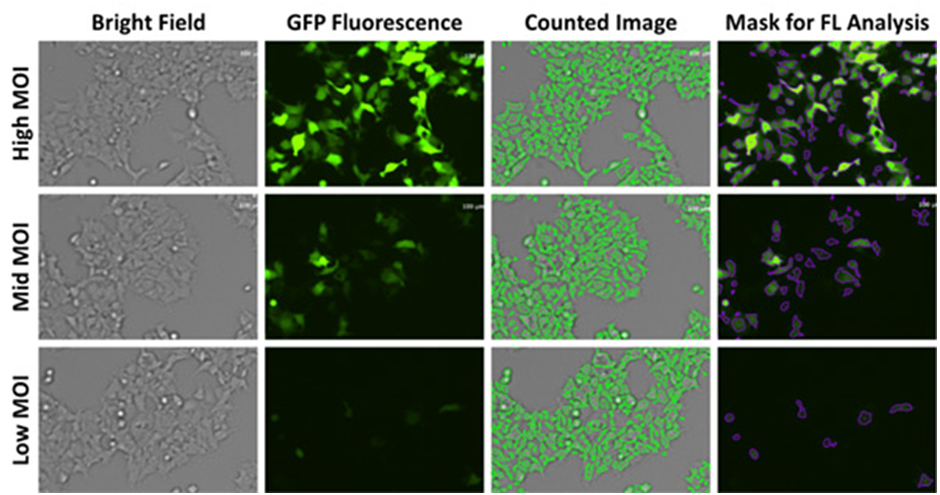
- After incubating overnight, the Celigo images and analyzes brightfield and green fluorescence to measure the transduction efficiencies at three MOIs for different serotypes of AAV-GFP vectors
- The software identifies and segments cells to provide counts of both total cells and GFP+ cells
Directly measure MOI and AAV-dependent transduction efficiencies
The Celigo image cytometer captures brightfield and green fluorescent images to directly count the total number of cells in brightfield and identify GFP+ cells to determine the transduction efficiencies for each MOI and AAV vectors (Figure 1). To calculate the efficiencies, the number of GFP+ cells was divided by the total number of cells counted per well. The results are shown in Figure 2 for high, mid, and low MOI, as well as different AAV vectors, where AAV-A, E, and C showed the highest GFP% out of the 6 tested, indicating high transduction efficiencies.
Figure 1. Brightfield and fluorescent images with segmentation using Celigo software to determine transduction efficiencies.
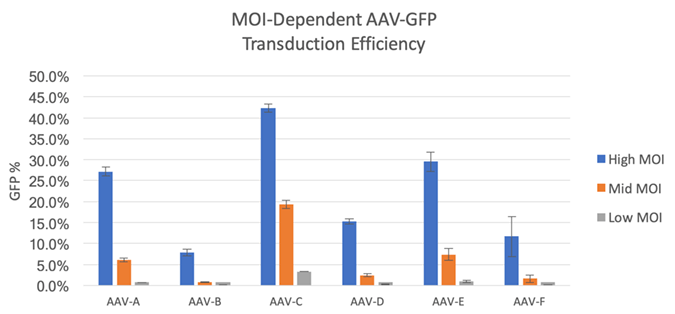
Figure 2. Measured GFP% for 6 AAV vectors at high, mid, and low MOIs.
Automatically measure fluorescent intensities to determine gene expression levels
In addition to providing high-resolution, whole-well images (Figure 3), the Celigo software automatically quantifies the integrated intensity (Figure 4). Larger and smaller areas around the region of interest (ROI) are measured, and the integrated intensity of the background is subtracted. This approach is more reliable for describing signal intensity independent of fluorophore density. This feature makes it easy for researchers to compare MOIs and select the best experimental conditions to maximize transduction efficiency.
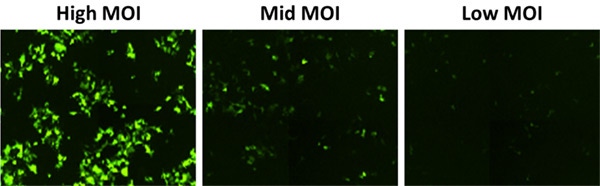
Figure 3. GFP fluorescent images at high, mid, and low MOI showing bright GFP signals at the highest MOI and decreased signal with mid and low MOIs.
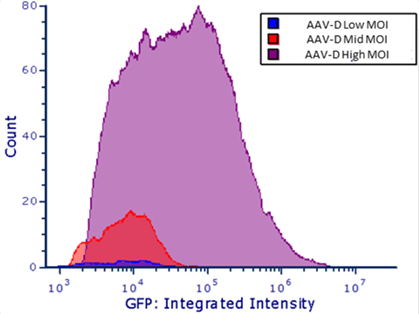
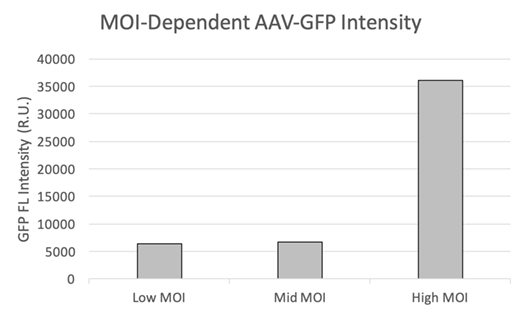
Figure 4. (a) Fluorescent intensity measurement using FCS Express™ to determine gene expression level. (b) The difference in GFP FL intensities for high, mid, and low MOIs.
You may also be interested in these products


Part number:
200-BFFL-5C

Part number:
CS2-0106-5ML,
CS2-0106-25ML
List price:
USD 133.00 - USD 606.00
Log in to view
your online price
")
List price:
USD 292.00 - USD 5,366.00
Log in to view
your online price
")
List price:
USD 292.00 - USD 5,260.00
Log in to view
your online price
of 5
For research use only. Not for use in diagnostic procedures.